3× Less Drawdown Stress
The Ulcer Index is a professional risk metric that measures both the depth and duration of drawdowns. Lower values indicate smoother equity curves and less capital stress over time.
Smart-HODL
9.71 9.71*
Lower drawdown pain, faster recoveries, and shorter time spent underwater.
vs
BTC Buy & Hold
32.61
Deep, prolonged drawdowns that keep capital trapped for months or years.
A more than 3× reduction in drawdown-related capital stress means smoother compounding, lower psychological pressure, and a far more resilient long-term strategy.
To truly understand the value of the Smart-HODL, we must look beyond short-term fluctuations and analyze how the algorithm performs across different market cycles. The results confirm a powerful truth: while the strategy keeps pace with the bulls, it excels in surviving the bears, leading to massive long-term outperformance.
The Bull Market Perspective (2024 – Present)
In a sustained upward trend, such as the period from January 2024 to now, the “Buy & Hold” strategy is a formidable opponent. As shown in the data below, Smart-HODL tracks the BTC price closely. Because the market hasn’t provided many extreme “Deep Value” entry opportunities, the algorithm remains highly efficient, matching market gains while keeping risk capital ready for a correction.
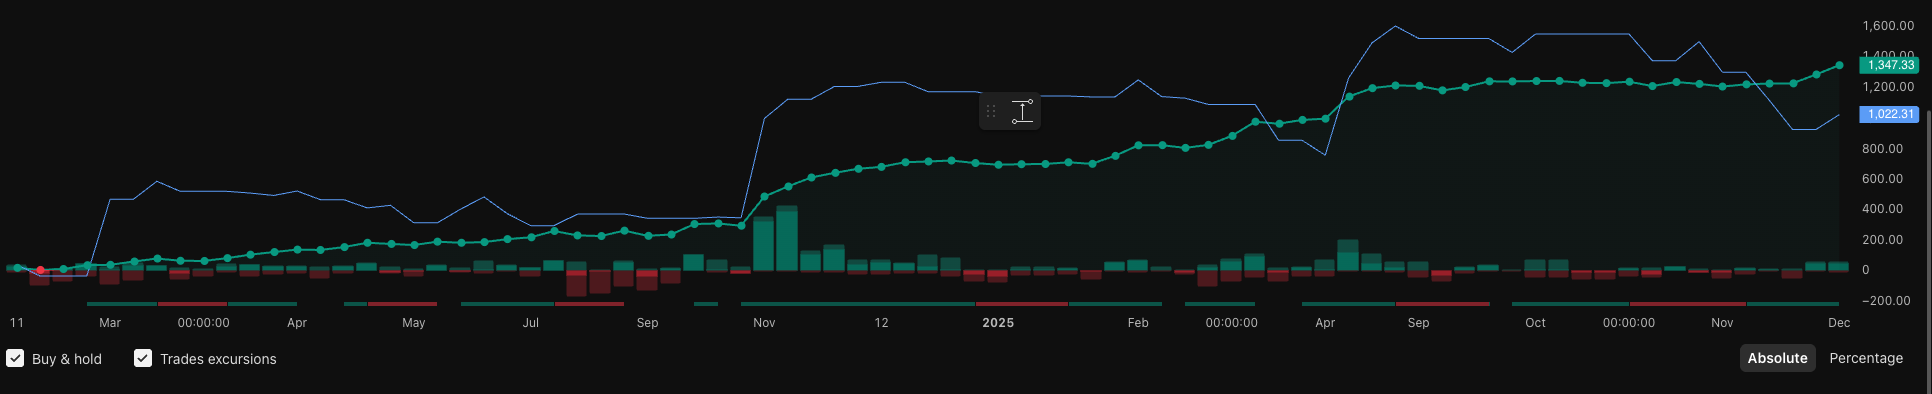
Figure 1: Comparison showing Smart-HODL tracking alongside Buy & Hold during the 2024 bull run (BTC 1D strategy).
The Long-Term Advantage (2020 – Present)
The true power of the strategy is revealed when we zoom out. Looking at the data from January 2020, we see that Smart-HODL beats the traditional Buy & Hold strategy by a significant margin. By successfully navigating the 2021 peaks and the 2022 bear market, the algorithm managed to avoid the worst drawdowns and reinvest profits at much lower price levels.
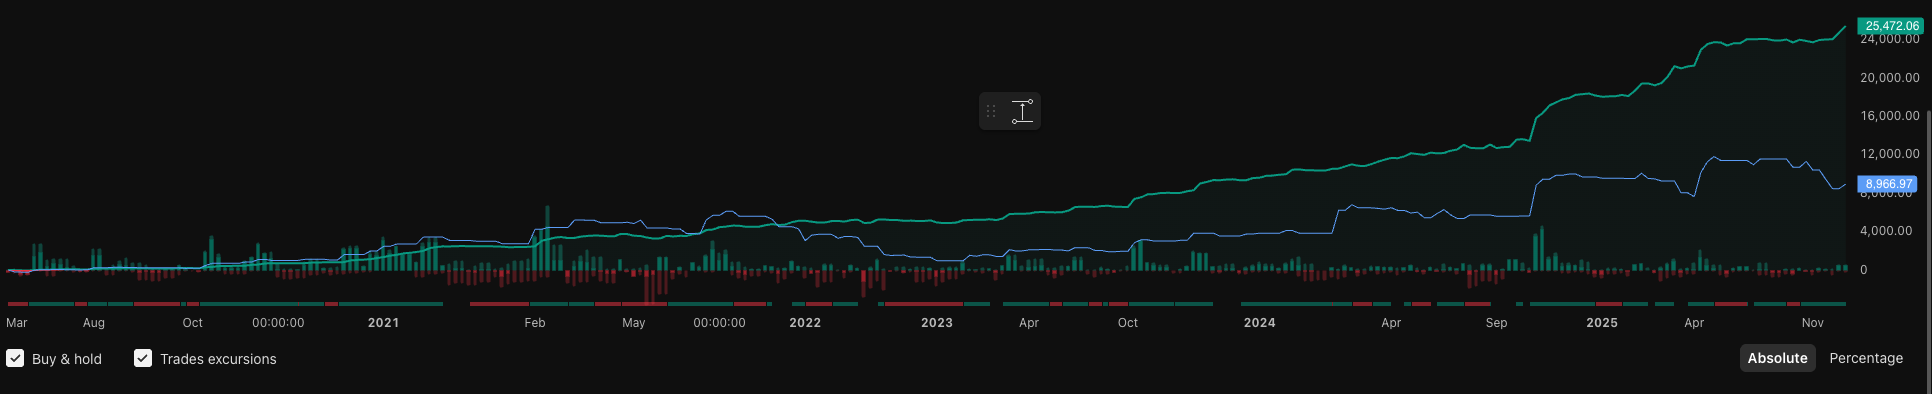
Figure 2: Multi-year performance demonstrating how avoiding drawdowns leads to exponential compounding superiority (BTC 1D strategy).
Superior Drawdown Management
Risk protection is not just about how deep losses go, but how long capital remains trapped in recovery. Since January 2020, Bitcoin Buy & Hold experienced a maximum drawdown of approximately ~57% and remained underwater for more than two years following the 2021 peak. Smart-HODL, by contrast, limited its maximum drawdown to 48.9% and recovered to new equity highs in roughly 19 months.
More importantly, the average time-under-water tells a much deeper story. While Buy & Hold typically remains below its previous highs for several months at a time, Smart-HODL’s average recovery period is measured in weeks, not months. This dramatically reduces psychological stress and frees capital for faster compounding.
This difference is quantified by the Ulcer Index, a professional risk metric that measures both the depth and duration of drawdowns. Smart-HODL achieves an Ulcer Index of just 9.71, compared to 32.61 for Bitcoin Buy & Hold — a more than 3× reduction in drawdown-related capital stress.
When evaluating efficiency, Smart-HODL converts drawdown into growth far more effectively. Its Recovery Factor (total return divided by maximum drawdown) is an order of magnitude higher than Buy & Hold, meaning every unit of risk taken produces substantially more long-term return.
Finally, Smart-HODL is not merely leveraged market exposure. Analysis shows that only about 47.5% of its drawdown periods overlap with Bitcoin’s drawdowns. In the remaining time, the strategy is either recovering or making new highs while the market is still underwater — a clear sign of active risk management rather than passive beta.
This long-term delta is the result of Compound Interest. Every time the algorithm buys the bottom of a crash and rebalances at the top, it increases the total “base” capital. Over several years, these small strategic wins stack up, creating a gap that Buy & Hold simply cannot close.
Where Smart-HODL Actually Sits
Smart-HODL is best described as a drawdown-aware, capital-efficient directional strategy . It is built to survive market cycles, not to promise immunity from volatility.
What Smart-HODL Does
- ✔ Accepts drawdowns as a natural part of market participation
- ✔ Reduces the depth and duration of drawdowns
- ✔ Converts volatility into a long-term compounding advantage
What Smart-HODL Does Not Do
- ✕ Eliminate losses during sudden market crashes
- ✕ Claim to be crash-proof or market-neutral
- ✕ Rely on leverage, hedging, or tail-risk insurance
Why This Matters
This balance is exactly why Smart-HODL is able to keep pace during bull markets while dramatically outperforming over full market cycles. Instead of avoiding volatility, the strategy uses it to improve long-term capital efficiency.
A Clear & Honest Statement
“Smart-HODL is not designed to eliminate losses during extreme market crashes, but to reduce their impact and recover faster than traditional Buy & Hold strategies.”